“Every morning, thousands of e-commerce store owners log into their dashboards and track their daily gross sales, celebrating a beautiful, surging graph.”
“We hit $5,000 today!”
“We did $50,000 this month!”
It feels amazing. It looks great in screenshot groups on Twitter or Reddit. But when it comes time to pay the credit card bills, pay for the next batch of inventory, or actually transfer money into a personal bank account, the crushing reality sets in: There is barely anything left.
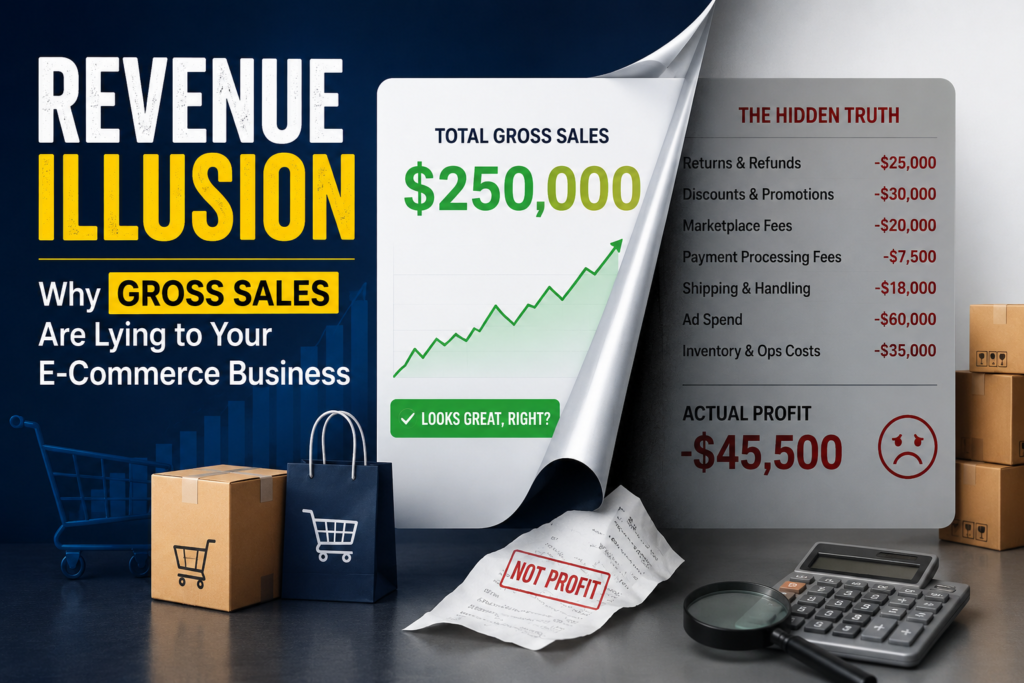
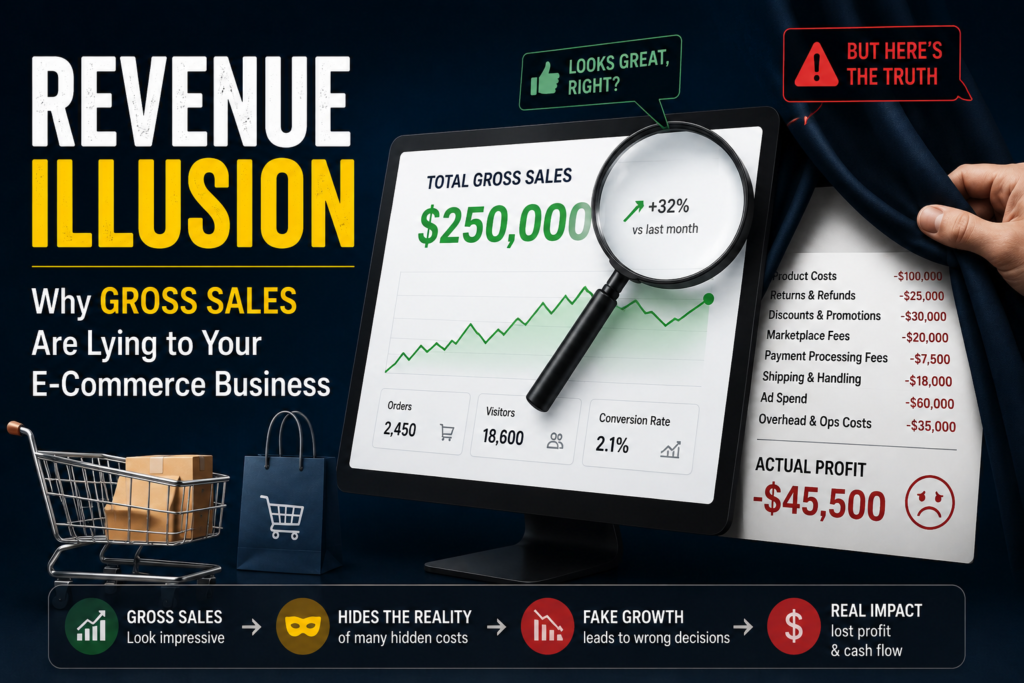
Welcome to the Revenue Illusion. It’s the number-one trap that bankrupts growing e-commerce businesses. If you are tracking your success purely by top-line revenue, you aren’t running a business—you’re running an expensive hobby.
The Hidden Margin Killers: Where Did the Cash Go?
The math of e-commerce seems simple on paper: Selling Price – Cost of Goods Sold (COGS) = Profit. But in the real world, your true Return on Investment (ROI) is constantly being eaten away by a hidden army of tiny, compounding fees. If you aren’t calculating these variables with precision before you source a product, you are bleeding cash in the dark:
- The Ad-Spend Trap: With advertising costs fluctuating daily, a slight drop in your Ad ROAS (Return on Ad Spend) can completely erase your product’s margin.
- Transaction & Platform Fees: Shopify fees, Stripe processing percentages, PayPal fixed cuts, or Amazon FBA referral fees take a bite out of every single transaction.
- The Shipping Squeeze: Fuel surcharges, packaging materials, and international shipping variances mean your estimated shipping cost is rarely what you actually pay.
- Returns and Damages: A $0 profit margin on a returned item doesn’t just mean a missed sale; it means you lost the original shipping fee, the ad click cost, and potentially the inventory asset itself.
Gross Revenue vs. Net Profit ROI: A Tale of Two Stores
To understand why gross sales don’t matter, look at two different store owners competing in the exact same niche:
| Metric | Store A (The “Hustler”) | Store B (The “Strategist”) |
| “Daily Gross Sales” | $10,000 | $3,500 |
| Product COGS | $4,500 | $1,000 |
| Ad Spend (Marketing) | $4,000 | $800 |
| Shipping & Platform Fees | $1,200 | $400 |
| Actual Net Profit | $300 | $1,300 |
| True Profit Margin | 3% | 37.1% |
Store A is doing massive volume, stressing out their customer support team, risking thousands of dollars in ad spend, and walking away with a pocketful of crumbs. Store B is doing a fraction of the sales, but taking home four times more actual cash.
Store B understands their true Profit ROI.
Stop Guessing. Start Calculating.
You cannot optimize what you do not accurately measure. To break free from the revenue illusion, you have to stop using messy spreadsheets that you forget to update, and stop relying on basic backend dashboards that hide your true operational expenses.
Before you launch your next marketing campaign or scale your inventory order, run your numbers through a dedicated financial utility tool. Break down your COGS, factor in platform fees, project your marketing overhead, and find your true break-even point.
The Golden Rule of E-Commerce: High revenue builds your ego. High profit builds your wealth. Focus on the bottom line.
Want to find your store’s true numbers in less than 60 seconds? Use our free [Profitroi.xyz E-Commerce Profit Margin Calculator] to instantly strip away the hidden fees and see exactly how much cash you are actually taking home.
E-Commerce Profit Margin FAQs
What is a good net profit margin for e-commerce?
While a gross margin around 50% is standard, a healthy net profit margin for most e-commerce brands typically ranges between 10% and 20% after accounting for marketing, shipping, and processing expenses.
Why does high revenue fail to guarantee business growth?
High gross revenue often hides massive ad spend, escalating returns, and hidden transaction cuts. If your cost to acquire a customer outpaces your lifetime value, higher volume only accelerates your losses.
Check out our homepageTools